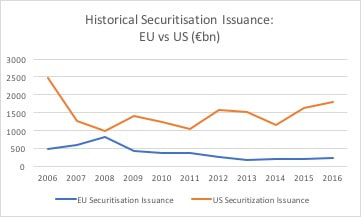
 The chart above shows the evolution of securitisation issuance in the EU compared with that of the US over the last decade. US securitisation issuance suffered severely in 2007 and 2008 following the US sub-prime mortgage scandals together with the abusive use of US securitisation in that debacle. Since then, US securitisation issuance has established a generally upward trend and the latest figures suggest that this trend will be maintained in 2017. With more than two trillion dollars of annual issuance, securitisation is an important driver of US economic growth.
On the other hand, despite extremely low default levels in EU securitisation structures during the financial crisis, the regulatory backlash in Europe was both harsh and complex. European issuance remained low as banks were unable to overcome the burden of increased capital charges and other restrictions on securitised assets. The resultant impact on the European economy is reflected in substantially reduced levels of liquidity and investment, sharply limiting the ability of banks to re-size balance sheets, improve capital ratios and resume lending to businesses of all sizes. It has taken more than a decade for the EU to finalise proposals to rebalance capital charges for qualifying securitised instruments in an effort to revive the EU securitisation market. The new regulatory framework will apply to Simple, Transparent and Standardised (STS) securitisation transactions. However, the STS regulation will not be implemented until 2019 and many doubt that it will generate a dramatic boost to issuance given the narrowness of the criteria and the complexity of the regulation.
0 Comments
|
AuthorKieran Desmond 
Archives
December 2017
Categories
All
|
 RSS Feed